
Punishments for not accepting ´Covid19 vaccines´:
Former PM Abe Shinzo was assassinated on stage on July 8, 2022.
Also 5 presidents who refused, #FivePresidents
Also 5 presidents who refused, #FivePresidents

- MAP PROVES THAT THE OFFICIAL STORY IS NOT THE TRUTH.
- The strongest earthquake intensity, is on land and not near or at sea.
- All traces of the original early reporting have suspiciously disappeared.
- THE 3/11 EARTHQUAKE IN JAPAN (2011) WAS NOT A 9.0.
- NO DAMAGE THAT WOULD SUGGEST A 9.0 EARTHQUAKE ACTUALLY OCCURRED ON 3/11.
Japan Quake Epicenter Was in Unexpected Location

Japan has been expecting and preparing for the “big one” for more than 30 years. But the magnitude-9.0 temblor that struck March 11 (3/11) – the world’s fourth biggest quake since 1900 – wasn’t the catastrophe the island nation had in mind.
The epicenter of the quake was about 80 miles east of the city of Sendai, in a strip of ocean crust previously thought unlikely to be capable of unleashing such energy.
“This area has a long history of earthquakes, but [the Sendai earthquake] doesn’t fit the pattern,” says Harold Tobin, a marine geophysicist at the University of Wisconsin-Madison.
“The expectation was high for a 7.5, but that’s a hundred times smaller than a 9.0.”
“The expectation was high for a 7.5, but that’s a hundred times smaller than a 9.0.”
Understanding where big earthquakes will emerge is extraordinarily difficult, and nowhere more so than Japan. The northern part of the island nation sits at the intersection of four moving pieces of the Earth’s crust. Where one tectonic plate slides beneath another, forming a subduction zone, sudden slippages can unleash tremendous amounts of energy.
The Sendai earthquake occurred at the Japan Trench, the junction of the westward-moving Pacific Plate and the plate beneath northern Japan. Historical records, one of seismologists’ best tools for identifying areas at risk, suggest that this segmented fault has produced several earthquakes bigger than 7.0 in the 20th century alone – but none bigger than 8.0.


USGS OFFICIAL DATA: M 9.1 - 2011 Great Tohoku Earthquake, Japan
2011-03-11 05:46:24 (UTC) | 38.297°N 142.373°E | 29.0 km depth
That’s why the Japanese government has long focused on the nation’s southern coast and the northward-moving Philippine Plate, which has a proven ability to generate large quakes. Quakes larger than 8.0 tend to strike the Tokai region in central Japan every 150 years or so, with the last big one appearing in 1854.

Current thinking about the mechanisms that govern megaquakes also favored the Philippine Plate as the site of greatest risk. About 80 percent of all earthquakes above magnitude 8.5 occur at the edges of such geologically young, warm tectonic plates. Kilometer-thick sediment layers carried by these plates are thought to grind smooth patches that allow long stretches of fault to rupture at once. The Pacific Plate, some of the oldest ocean crust on the planet, doesn’t fit this description.
But preliminary computer simulations at Harvard that crunched early data from the Sendai quake suggest that a long stretch of the Japan Trench ruptured during the event – about 390 kilometers [240 miles]. Multiple segments that usually behave independently broke over the course of two to three minutes.
“It looks like three of the segments all slipped together,” says Miaki Ishii, a seismologist at Harvard. “There is some evidence that a fourth may have been involved as well.” She doesn’t know why these particular segments ruptured together, or why other similar segments nearby didn’t join them.
What does seem to be clear is that the slip happened in a relatively shallow region of the subduction zone. According to computer simulations run by geophysicist Chen Ji at the University of California, Santa Barbara, the quake originated 8 to 20 kilometers [5 to 12 miles] below the ocean floor. The shallower an earthquake, the more easily it flexes the Earth’s crust, raising a mountain of water that can turn into a tsunami. The Sendai quake lifted the seafloor several meters and generated a tsunami up to 7 meters [23 feet] high.
“We’re learning that we can’t discount any of these big subduction zones,” says Tobin. “They’re all capable of producing large earthquakes.” The magnitude-9.1 earthquake that struck Sumatra in 2004 also broke the rules: It, too, happened on the edge of an old piece of crust, hurling a tsunami across the Indian Ocean that was more deadly than any in recorded history.
In the United States, seismologists are now eyeing the Cascadia fault zone that flanks Oregon and Washington, which last gave way in 1700 to produce the largest known earthquake in North American history.
“Perhaps the earthquake in Japan shouldn’t have been as surprising as it was,” says Stanford seismologist Greg Beroza.
Beroza explains that deposits of sand found kilometers from shore have revealed a large tsunami that struck the Sendai area during the Jogan earthquake of 869. Ever since this magnitude-8.0+ quake, the Pacific Plate has been moving more than 8 centimeters [3 inches] per year – a tectonic sprint – pushing against its neighbor plate and perhaps building a tremendous amount of strain.
Seismologists hope that the detailed Sendai earthquake data collected by Japan’s advanced monitoring technologies – hundreds of sensors spaced an average of 20 to 30 kilometers [12 to 18 miles] apart across the Japanese islands – will lead to a better understanding of subduction zone quakes. Researchers will also analyze the emerging pattern of aftershocks, which now includes at least three bigger than 7.0 and dozens bigger than 6.0.
But being able to spot signs far in advance of a big earthquake – currently far beyond the reach of modern science – may require digging deeper. Tobin and his Japanese colleagues have for the first time embedded strain sensors directly inside a subduction zone, the Nankai trough located southwest of Tokai.
Large earthquakes have struck this region every 100 to 120 years, from 686 to 1946. The researchers hope to catch the next big one in the act and find a warning sign that could provide more than a minute’s notice that a monster quake is on its way.
Images: The March 11 Sendai earthquake (epicenter shown as star) occurred when the westward-moving Pacific Plate took a sudden dive beneath northern Japan’s plate, the identity of which is disputed among scientists. (USGS)
See Also:
- Japan Struggles to Control Quake-Damaged Nuke Plant
- Earthquake Is Biggest in Japan's Recorded History
- Midway's Albatrosses Survive the Tsunami
- The Tsunami's Ripple Effect
- Satellite Photos of Haiti Before and After the Earthquake
- Double-Whammy Earthquake Caused Tsunami
- Can Hurricanes Trigger Earthquakes?
2011/03/11 05:46:00
http://isc-mirror.iris.washington.edu/cgi-bin/web-db-v4?event_id=16461282&out_format=IMS1.0&request=COMPREHENSIVE___
MAP PROVES THAT THE OFFICIAL STORY IS NOT THE TRUTH
The map below of the Miyagi prefecture, provided and used by Yoshiharu Shumuta Central Research Institute of Electric Power Industry Civil Engineering Lab., proves that the official story is NOT the truth.
As you can see, the strongest earthquake intensity, on March 11, 2011, is on land and not near or at sea. Also this FACT is very important, since it is completely the opposite of what we should expect if there really was a 9.0 earthquake.
How can the earthquake intensity readings of station MYG004 (red zone) be 6.67, while MYG011 (green and yellow zone) registered only 5.63 although MYG011 was the closest to the epicenter?
Since the strongest earthquake was ON LAND it is fair to conclude that the sea quake was far less than the official 9.0 magnitude.
It has therefore again been proven that the official story is false and that Jim Stone’s report is correct.

Miyagi prefecture

THE REAL 3/11 EARTHQUAKE & PROOF OF THE USGS TAMPERING WITH EARTHQUAKE DATA
Since it has already been proven numerous times that the official narrative about the March 11, 2011, earthquake in Japan is not the truth, that there wasn’t an earthquake with a 9.0 magnitude that occurred that day, and given the fact that practically all traces of the original early reporting have suspiciously disappeared it is required to backtrack the true values of the earthquake magnitude and intensity.
Doing so will lead to a more credible result than that that the official narrative puts forward and it will help people to better understand the actual situation of that day in Japan, on March 11, 2011.
Keep in mind that the listed animation/chart in cartoon format (image 4), provided and used by the Japan Meteorological Agency (JMA), describes and indicates the seismic intensity of an earthquake, and that the Japan Meteorological Agency issues the seismic intensity information within about two minutes from an earthquake to provide information on the regions where seismic intensity of 3 or more was observed, and that the location and magnitude of an earthquake is determined within about three minutes.
In case of no tsunamigenic earthquake, the message of “Tsunami is not expected” is added. That message was more than likely added on March 11, since most people were surprised and unprepared when the tsunami arrived.
In case of no tsunamigenic earthquake, the message of “Tsunami is not expected” is added. That message was more than likely added on March 11, since most people were surprised and unprepared when the tsunami arrived.
According to the official story the strongest earthquake magnitude recorded on March 11, 2011, was 9.0.
This would therefore equal an intensity of XII (12) on the Modified Mercalli Scale or an intensity of VII (7) on the JMA Scale.
This would therefore equal an intensity of XII (12) on the Modified Mercalli Scale or an intensity of VII (7) on the JMA Scale.
Lets compare this with what is being stated by the Japan Meteorological Agency in image 4.
7 (VII) on the JMA Scale is the last table and the strongest value, it describes:
- “Wooden houses with low earthquake resistance are even more likely to lean or collapse”
- “Wooden houses with high earthquake resistance may lean in some cases”
- “Reinforced-concrete buildings with low earthquake resistance are more likely to collapse”
- And most importantly here is that it does not even describe anymore how people will react, how they would move because in the previous value 6 (VI) it is stated that “it is impossible to move without crawling. People may be thrown through the air.” What could possibly be more intense than being thrown in the air?
Taking the above information in account, and even if we would use the strongest officially recorded earthquake intensity of 6.67, it can be confirmed that the official story and the accompanying values of the earthquake magnitude and intensity are not the true values, that the official story is not the truth, since no one has been seen being thrown in the air nor was there widespread earthquake damage anywhere in Japan [1, 2].
All the major damage was caused by the tsunami!
All the major damage was caused by the tsunami!
Not to mention how bad the USGS has failed to edit their chart correctly (image 2), while they were rushing to make the official narrative look authentic.
Therefore, lets take a look at what the real situation was like, based on actual video material of that day in Japan, on March 11, 2011.
A news room in Sendai:
Video link: http://www.youtube.com/watch?v=Vx3ELotauVM
The “6 Lower” earthquake intensity value equals 10 (X) on the Modified Mercalli Scale, which equals an earthquake magnitude of 7 on the Richter Scale. This value perfectly matches the 7.0 that was originally reported as being the strongest earthquake magnitude ON LAND (not at sea) in the Miyagi prefecture and as stated by the smiling drama queen. This would also explain why Dr. Robert Jacobs didn’t feel or know a thing of/about the earthquake, in Hiroshima, until his friends called him on the phone to ask him if he was OK.
Since the strongest earthquake magnitude value (7.0) was recorded and reported in Miyagi and not at sea, the official narrative regarding the alleged (FAKE) 9.0 magnitude is again proven to be a fraud.
The fact that the earthquake data has been tampered with by the USGS gives it therefore all the more reason to put trust into the investigations that the tsunami did not occur naturally, that it was triggered on purpose, which would have to be qualified as eco-terrorism and an act of war [1, 2] rather than as an “accident” like the official story wants us to believe.
Image 1 (Missouri Department of Natural Resources)

Image 2 (here the USGS clearly failed to edit their chart correctly, this is proof that they are tampering with the real data and that the official story is not the truth! We will not base our investigation on this chart, image 2, because as you can see the most intense magnitude value, 7.0 and higher, does not correspond with the modified Mercalli value. Compared to the same magnitude value, 7.0 and higher, based on image 1 the tampering by the USGS becomes more than obvious. When you’re rushing to get the fraudulent job done you make mistakes!!)

Image 3 (Berkeley University of California)
____
THE 3/11 EARTHQUAKE IN JAPAN (2011) WAS NOT A 9.0
On of the first, biggest and most important lies about the attacks on Fukushima, Japan, is about the earthquake itself from March 11, 2011, which was NOT a magnitude 9.0 earthquake.
In fact it can be confirmed and proven in multiple ways that the strongest earthquake on that day could not have been any stronger than 7.0 in magnitude and 6.67 in intensity.
How can we know this for sure?
1. DATA FROM THE UNIVERSITY OF TSUKUBA, JAPAN


On the following graphic copied from their official website ( http://www.kz.tsukuba.ac.jp/~sakai/113g.htm ) you can witness for yourself that the University of Tsukuba registered no stronger earthquake magnitude than 6.67 (MYG004) on March 11, 2011.
The nearest station to the deliberately triggered earthquake in sea, that caused the tsunami, is MYG011 which recorded 5.63 only.
* * *
University of Tsukuba
The University of Tsukuba (筑波大学 Tsukuba daigaku), located in Tsukuba, Ibaraki,
 is one of the oldest national universities
(established by Japanese Government) and one of the most prestigious universities in Japan. The university has 28 college clusters and schools with around 16,500 students (as of 2014).[1] The main Tsukuba campus covers an area of 258 hectares (636 acres), making it the second largest single campus in Japan.[2] The branch campus is in Bunkyo-ku, Tokyo, which offers graduate programs for working adults in the capital and manages K-12 schools in Tokyo that are attached to the university.

(established by Japanese Government) and one of the most prestigious universities in Japan. The university has 28 college clusters and schools with around 16,500 students (as of 2014).[1] The main Tsukuba campus covers an area of 258 hectares (636 acres), making it the second largest single campus in Japan.[2] The branch campus is in Bunkyo-ku, Tokyo, which offers graduate programs for working adults in the capital and manages K-12 schools in Tokyo that are attached to the university.
The university's academic strength is in STEMM fields (Science, Technology, Engineering, Mathematics, Medicine), physical education, and related interdisciplinary fields. It is by taking located in Tsukuba Science City which has more than 300 research institutions.[3] The university has had three Nobel laureates (two in Physics and one in Chemistry, see also "History"), and about 70 athletes, their students and alumni, have participated in the Olympic Games.[4]
It has established interdisciplinary Ph.D. programs in Human Biology and Empowerment Informatics, and the International Institute for Integrative Sleep Medicine, which were created through the Ministry of Education, Culture, Sports, Science and Technology's competitive funding projects.
Its Graduate School of Life and Environmental Sciences is represented on the national Coordinating Committee for Earthquake Prediction.[5]
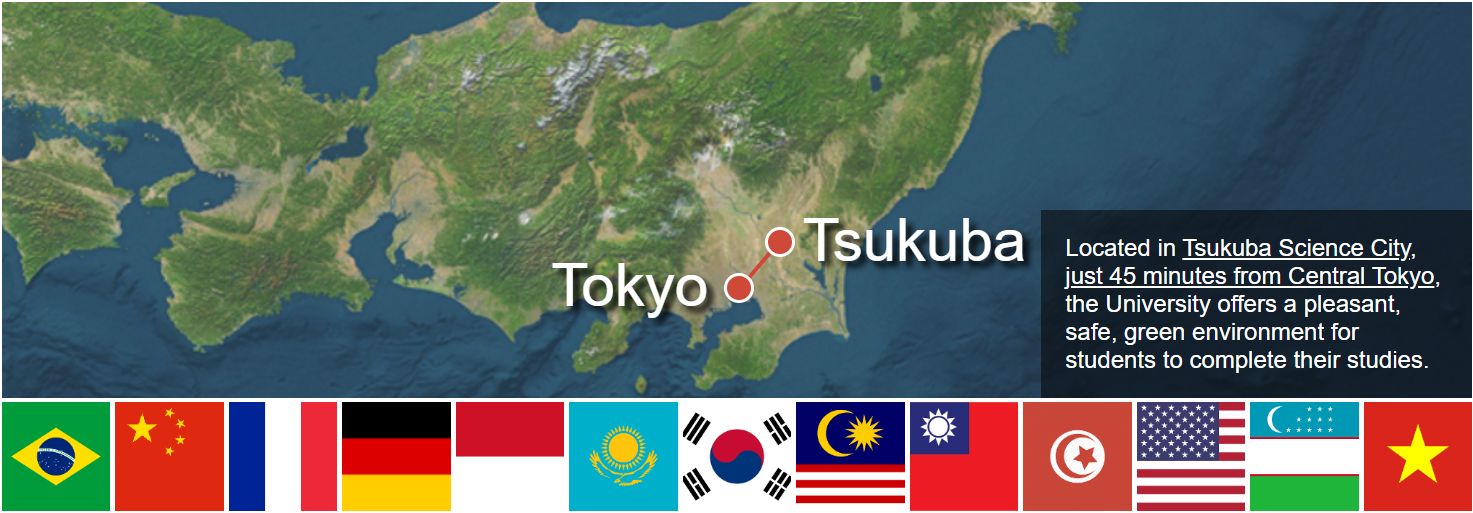
With a history stretching back over 140 years, the University of Tsukuba is one of Japan's oldest and most respected universities. Ranked in Japan's top 10, and in the top 250 globally, we strive to produce graduates who are well placed to succeed in an increasingly complex and competitive world.
www.global.tsukuba.ac.jp | www.tsukuba.ac.jp/english
3/15’11
発生した地震動の性質-2011年東北地方太平洋沖地震
発生した地震動の性質-2011年東北地方太平洋沖地震
IWT007(釜石) 741.6 31.1 5.74
IWT012(北上) 610.2 50.1 5.93
IWTH02(玉山) 709.0 19.7 5.57
IWTH05(藤沢) 766.9 33.8 5.63
IWTH20(花巻南) 407.4 38.0 5.61
MYG002(歌津) 770.8 26.2 5.68
MYG003(東和) 868.6 33.5 5.55
MYG004(築館) 2765.2 105.8 6.67
MYG007(豊里) 689.3 38.4 5.81
MYG008(北上) 398.2 42.6 5.58
MYG010(石巻) 481.9 65.8 5.93
MYG011(牡鹿) 929.3 37.8 5.63
MYG012(塩竈) 1970.3 63.7 6.02
MYG013(仙台) 1807.4 82.5 6.38
MYG015(岩沼) 429.0 79.0 5.99
MYG017(角田) 355.3 52.6 5.83
MYGH09(白石) 341.9 36.5 5.55
MYGH10(山元) 1025.6 62.4 6.07
FKS001(相馬) 659.9 58.9 5.85
FKS019(二本松) 458.8 29.5 5.57
FKS023(会津若松) 451.5 41.7 5.86
FKSH10(西郷) 1075.8 36.8 6.00
FKSH11(矢吹) 503.4 55.0 5.82
FKSH12(平田) 434.7 34.6 5.65
FKSH18(三春) 614.8 43.0 6.01
FKSH19(都路) 857.1 61.5 5.99
IBR001(大子) 454.0 34.5 5.59
IBR002(高萩) 619.1 52.1 5.98
IBR003(日立) 1844.3 70.9 6.46
IBR006(水戸) 843.6 38.8 5.80
IBR007(那珂湊) 550.3 50.1 5.88
IBR010(下妻) 430.4 39.2 5.57
IBR011(つくば) 370.6 46.2 5.61
IBR012(石岡) 358.7 43.4 5.55
IBR013(鉾田) 1613.8 69.9 6.41
IBR014(土浦) 527.0 44.6 5.63
IBRH11(岩瀬) 951.1 63.6 6.24
IBRH12(大子) 683.9 33.8 5.77
IBRH13(高萩) 561.5 34.8 5.72
IBRH15(御前山) 988.2 36.4 5.74
IBRH16(山方) 661.5 29.2 5.68
TCG001(黒磯) 485.2 38.4 5.52
TCG006(小川) 421.1 75.3 5.97
TCG013(真岡) 430.7 38.9 5.74
TCG014(茂木) 1275.7 65.6 6.34
TCGH10(大田原) 672.8 44.5 5.71
TCGH12(氏家) 481.5 42.9 5.59
TCGH13(馬頭) 906.2 64.6 6.14
TCGH16(芳賀) 1221.7 81.9 6.50
GNM009(桐生) 410.4 30.7 5.53
CHB003(白井) 485.9 30.8 5.60

* * *
“The date listed at the top is the date of compilation, Japan has thousands of seismic stations run by numerous organizations, and they take time to merge into one final report. That is the date listed at the top of this compilation (March 15), and there is a shill out there who can’t figure this out, a fact which should be obvious because the main seismograph in this report is dated and timed to the quake, and is a match for the lower resolution seismograms in this large compilation.” – Jim Stone
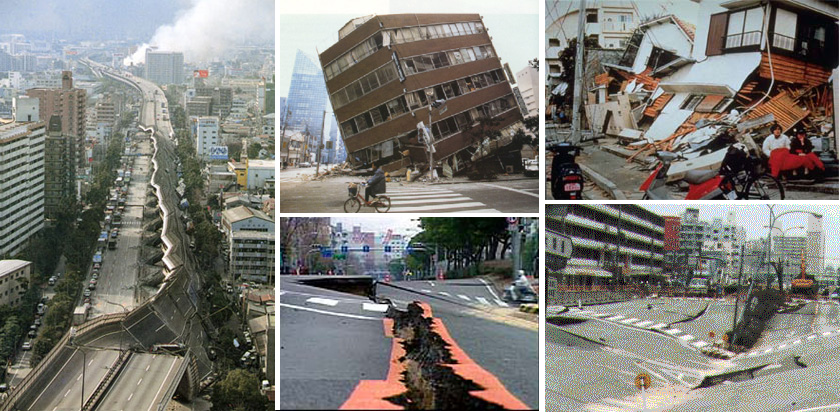
2. NO DAMAGE THAT WOULD SUGGEST A 9.0 EARTHQUAKE ACTUALLY OCCURRED ON 3/11

In addition to this March 11, 2011, photo material that clearly proves that there’s no earthquake damage available to be detected, video material also proves the exact same fact. NO 9.0 earthquake damage anywhere!
The following videos were filmed on March 11, 2011, and provide a perspective from various angles and in different situations. You can view the videos on-site or watch them on Youtube.
Make sure you see the same videos here and on Youtube because video sabotage is a reality.
Make sure you see the same videos here and on Youtube because video sabotage is a reality.
Original 3/11/2011 Video: News Room in Sendai (Japan 2011) – 6.67 Earthquake NOT 9.0!
Video link: http://www.youtube.com/watch?v=Vx3ELotauVMMarch 11, 2011, Tsunami Smashing Town in Japan but NO Earthquake Damage
Japan’s March 11, 2011, Tsunami, and Train but NO Earthquake Damage
Driver Films Japan’s March 11, 2011, Tsunami but NO Earthquake Damage
First Moments of March 11, 2011, Tsunami in Japan but NO Earthquake Damage
View more video material on Youtube
Try to find any structural EARTHQUAKE damage (not tsunami damage).
Try to find any structural EARTHQUAKE damage (not tsunami damage).
It can be observed in both the photo material and the video material that not even wooden structures have collapsed nor did any poles fall over. Cars in both the visual materials are still perfectly parked or waiting in line on the streets. Yet another sign that no 9.0 earthquake ever took place on March 11, 2011. Again, 6.67 is the strongest intensity and 7.0 the strongest magnitude recorded on March 11, 2011.
To give you an idea of what the damage after a 9.0 earthquake at least just look like, consider these events.
The 2013 Bohol (Philippines) earthquake, magnitude 7.1/7.2:


It is therefore clear and proven that there was NO 9.0 earthquake in Japan on March 11, 2011.
“The Kobe quake was a 6.9/7.2 depending on the source. That makes this quake, at a 9.0 100 times as powerful. Sendai for example was near the epicenter, where station MYG012 was and would have been devastated if it really happened as stated by the USGS. Sendai was only 48 miles from the epicenter of this alleged “9.0” earthquake which would have devastated everything in an area 1,000 miles across if it was real. All of Japan would have been damaged or destroyed.
A 9.0 is such a huge quake that China, Korea, and Russia should have seen significant earthquake damage from one happening in Japan and everything in Sendai should have been leveled. Yet no nation outside of Japan could even feel it. To shake Tokyo, a second fake earthquake was triggered near seismic station IBR003. All of this is in the official Japanese seismic record.
Erol Kalkan, a former Turkish Persian now working for the USGS, fabricated phony USGS ground accelerations to support a 9.0 scenario, and the U.S. government is still unfortunately trusted with this type of work. So Europe and the rest of the world are looking at the phony USGS reports.” – Jim Stone
__
Fukushima Nuclear Waste On USA Beaches & In Seafood! (Update 2017)
__
28 Signs That the West Coast Is Being Absolutely Fried with Nuclear Radiation from Fukushima
__
Fukushima Radiation in U.S. West Coast Tuna
__
New fear of explosions in Fukushima — Nuclear waste threatens to “spontaneously combust” — Millions of tons of radioactive material could be released
__
Pocket Geiger counter for Smartphones - Chernobyl and Fukushima
__
Chernobyl, Ukraine 1986: Deposition of radioactivity by Chernobyl nuclear power plant in 1986
This is not Fukushima Daiichi, this is a food store in Finland.
Life-threatening nuclear radiation risk (even 113,07 μsv/h) in the Baltic Sea Herrings.
C-137 contamination have landed on the sea bed, sediments, origin from Chernobyl disaster on yr 1986.
- Fishes found in a Food Store Shelter in Finland.
Measured from 24 th to 26th May 2017.
Devices: 2 x FTLAB Smart Geiger. The Best Geiger Counter For Smartphones.
herring are typically contamined by radioactive
Cesium 137.

NOW YOU CAN SEE ON YOUR MOBILE PHONE THE RADIATION, ALREADY AT THE GROCERY!
DIGITAL | TECHNOLOGY | FUKUSHIMA INNOVATION.
PATENTED, CE and ROHM certified.


Cesium 137.


Personal Geiger Monitor for Smartphone
Anytime, Anywhere
No more worries on radioactivity for my family
You can easily check the danger of radioactivity just place it near the suspicious object!
Anytime, Anywhere
No more worries on radioactivity for my family
https://graviolateam.blogspot.com/p/geiger-counter-portable-radiactive.html
P3251127, 113,07usv/h
Bottom trawled fish as pollock, salmon and herring
are typically contamined by
radioactive Cesium 137
Bottom trawled fish as pollock, salmon and herring
are typically contamined by
radioactive Cesium 137
https://www.youtube.com/watch?v=9RLrHx1kC1M
https://graviolateam.blogspot.com/p/geiger-
counter-portable-radiactive.html
___
Remember Chernobyl disaster on 1986 and Fukushima on 2011
Remember Chernobyl disaster on 1986 and Fukushima on 2011

Chernobyl 1986 fallout. C-137.
Scandinavia pollution map.
Radiation landed on the Seabeds. (Helcom)


 Chernobyl, Ukraine 1986:
Deposition of radioactivity by Chernobyl
nuclear power plant in 1986
_____
Gobal deposition of Cesium-137 during
the first 80 days – 2014 model
by Cyprus Institute Visualisation Lab

Scandinavia pollution map.
Radiation landed on the Seabeds. (Helcom)

 Chernobyl, Ukraine 1986:
Deposition of radioactivity by Chernobyl
nuclear power plant in 1986
by Cyprus Institute Visualisation Lab
Fukushima fallout on air on 2011


Fukushima fallout on the Pacific Sea (Enenews)
Ei kommentteja:
Lähetä kommentti
You are welcome to show your opinion here!