
- The cycle threshold (Ct) value is the number of cycles needed for the virus to be detected from the person’s sample.
- The higher the Ct value the smaller the amount of virus present in the sample.
- Most medical experts agree that Ct values over 33 likely indicate non-infectious, non-contagious levels of the virus.

https://rifreedom.org/wp-content/uploads/RI-COVID19-Ct-AveDaily-022920-063020.jpg
Reporting of COVID-19 Ct Values Can Better Shape Public Policy
Not All Positive Tests Are the Same
Despite months of stonewalling of prior APRA requests … and just one day after a petition campaign by the RI Center for Freedom & Prosperity sent over 1,000 emails to various state-government officials, including the DOH and the governor … the Center has obtained information released to a persistent citizen by the state Executive Office of Health and Human Services; partial data covering a limited number of positive Covid-19 tests performed before July 2020.
According to Dr. Andrew Bostom, Covid-19 advisor to the Center and Rhode Island resident, a Brown University degreed epidemiologist, academic internist, and clinical trialist:
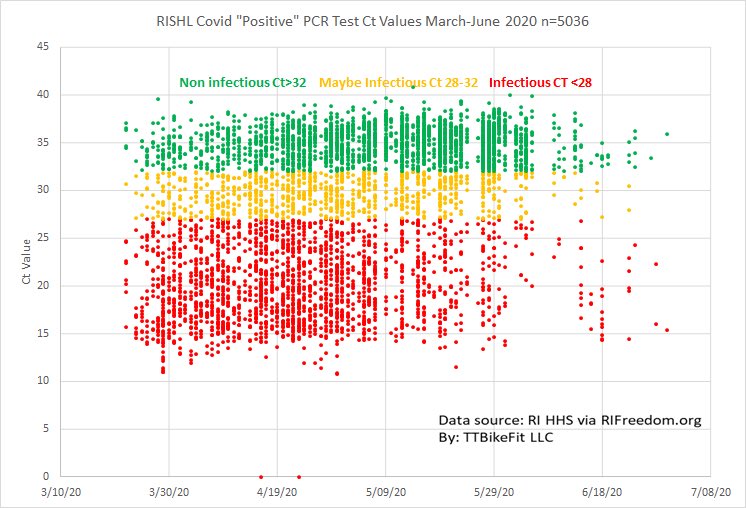
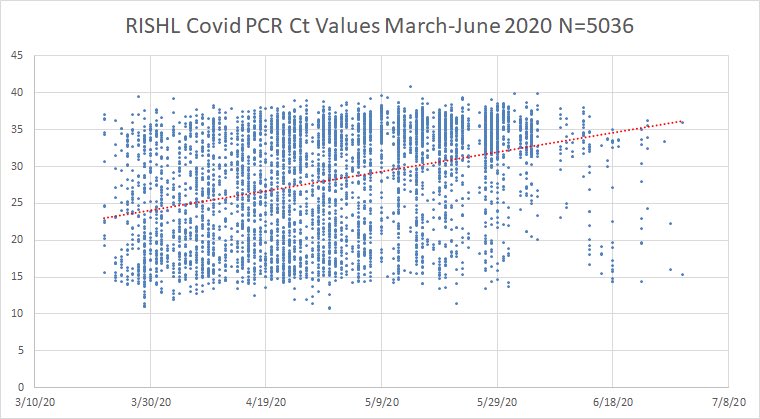
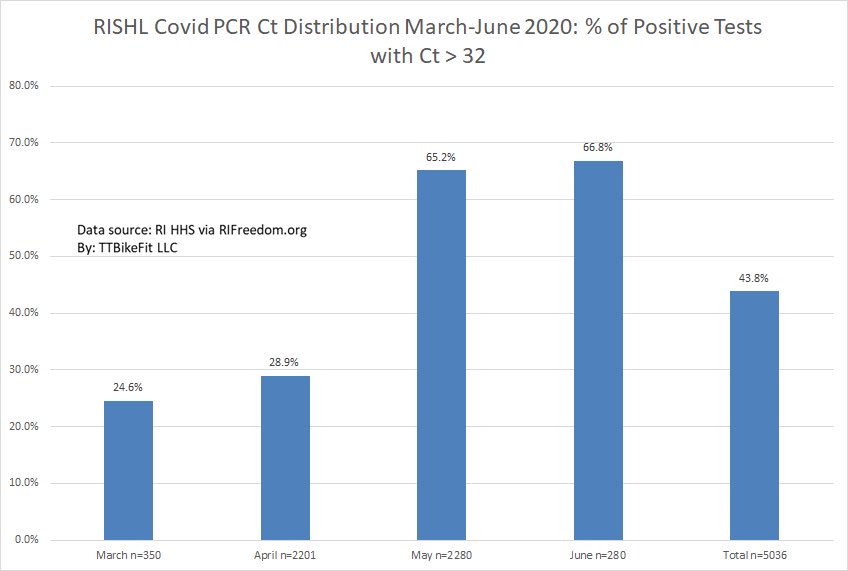
“This first public revelation of cycle threshold (Ct) data, from over 5,000 RIDOH covid-19 rtPCR positive tests from late February through the end of June, reveals that a considerable number (36.2%) of these positive tests occurred at a Ct > 33, a level generally considered by the medical community to be associated with extremely low Covid-19 infectiousness.
Initial analysis of this data also confirms the need for all future RIDOH reports of daily positive test results to include breakdowns of the Ct data.
Deeper analysis of even more data can be immensely important in determining more data-driven, targeted, and effective public policies. I join with the Center in petitioning the state of Rhode Island to follow Florida’s lead and to immediately begin collecting and reporting Ct data for all Covid-19 PCR tests.”
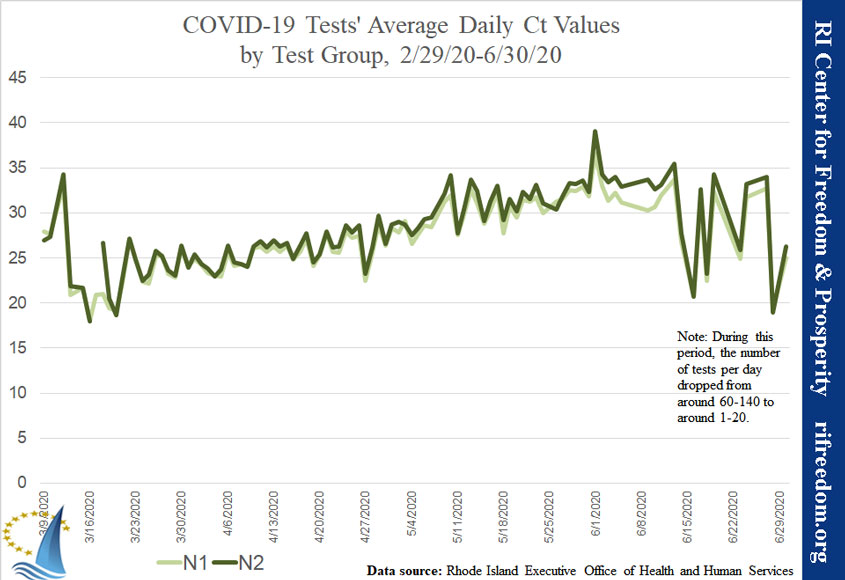
The data includes 9,878 COVID-19 tests divided into two “N” groups corresponding to each other by day from February 29, 2020, through June 30, 2020.
The cycle threshold (Ct) value is the number of cycles needed for the virus to be detected from the person’s sample. The higher the Ct value the smaller the amount of virus present in the sample.
Most medical experts agree that Ct values over 33 likely indicate non-infectious, non-contagious levels of the virus. In practice, for example, the country of India only triages (treats or closely monitors) cases where the Ct values are less than 25.
Routine government collection and detailed reporting of this data can be enormously helpful in determining public policy, and in informing patients and their doctors when it comes to determining more appropriate individual quarantine and medical treatment regimens.
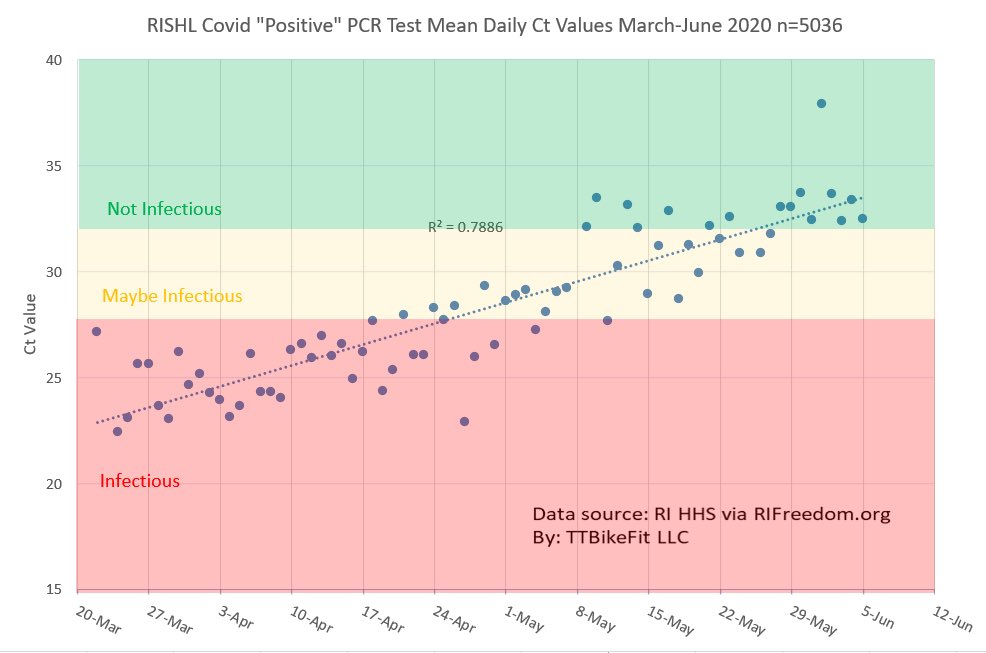
Of the total tests reported in Rhode Island, 51% had Ct values of 30 or higher, while 66% had values of 25 or higher.

Considered over the span of the report, Ct values gradually rose through May, after which they dropped along with the number of tests being conducted per day.
___
221 views
TNK ![]()
Recall I previously showed the Ct values of more than 5000 C19 PCR tests from the RI state health lab. Here they are again color coded for estimated infectivity. While all these folks were “positive”...
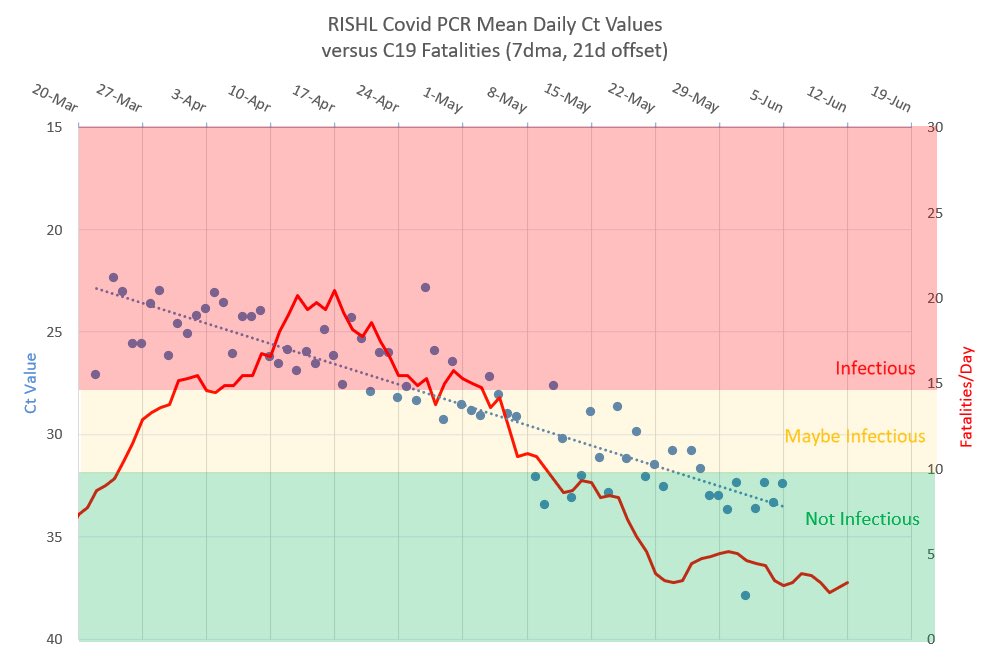
Seems like reporting and tracking of Ct values would be very important for tracking the severity and progress of the pandemic! Trends in Ct PREDICT severity - and why wouldn’t they as Ct tracks viral load!
https://threadreaderapp.com/thread/1338698633336774657.html
449 viewsTNK

____
Ei kommentteja:
Lähetä kommentti
You are welcome to show your opinion here!